The MND Sheinbaum Index™: Sheinbaum scores 60.0 for April 2026
THE MND SHEINBAUM INDEX™
Measuring Mexico’s president beyond the polls
MND Intelligence · Second edition
Welcome to the second edition of the MND Sheinbaum Index™, an eight-pillar index designed to give our readers balanced, data-driven insight into the current situation in Mexico across a range of areas.
As we wrote in our inaugural Sheinbaum Index article last month, most of what you hear anecdotally about Claudia Sheinbaum fits into one of two buckets: breathless admiration or reflexive dismissal, often without a lot of evidence or data to support the opinion expressed.
Neither tells you much about how Mexico is actually doing on her watch. The MND Sheinbaum Index™ was built to fill that gap.
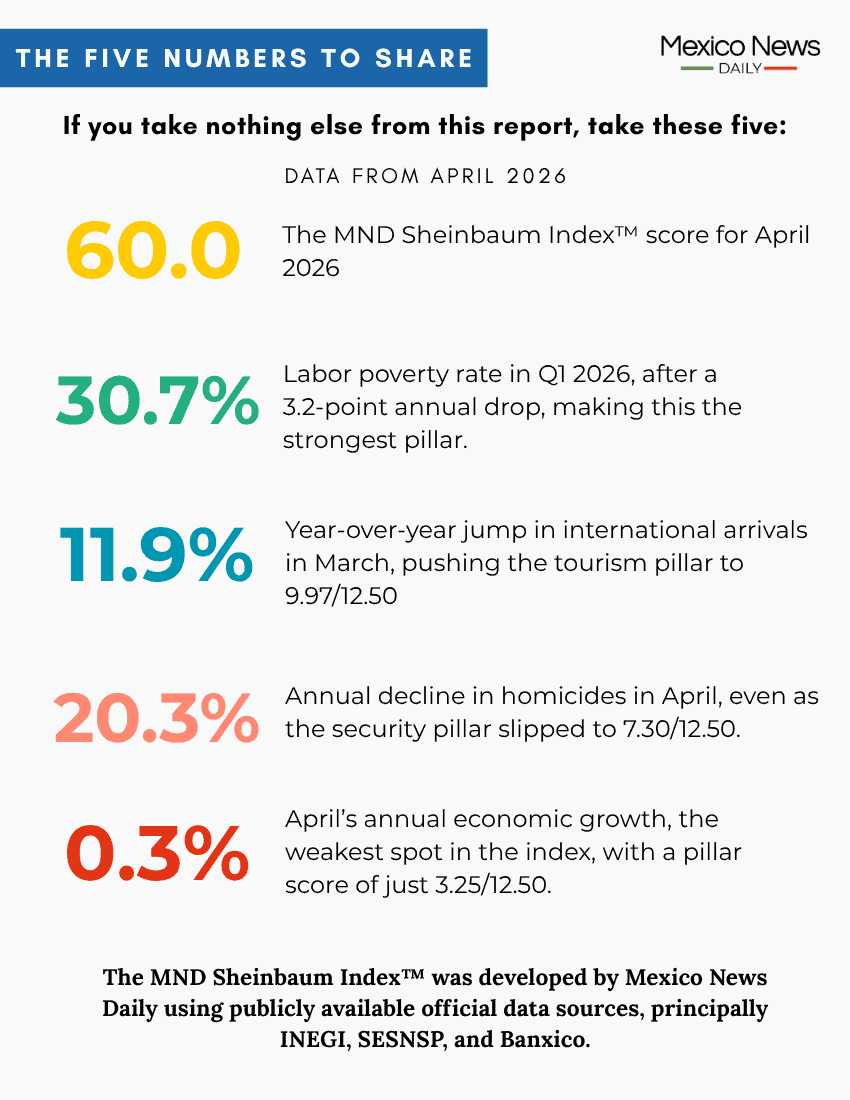
In this second edition of the index, the headline number is 60.0, representing a 0.1-point deterioration compared to March. That is not to say that nothing changed. As you will see below, four of the pillar scores improved in April, while four deteriorated. These changes effectively canceled each other out, resulting in only a minimal month-over-month variation to the overall index score.
We obtained the index score for April by applying the MND Sheinbaum Index™ methodology to the raw data we collected across eight pillars.
In the sections below, we remind you how the index works and what the overall index score means, and detail how the data across each of the eight equally-weighted pillars is scored.
We also examine how the MND Sheinbaum Index™ has changed over the past five months and home in on the performance of each of the pillars in April.

How the Index Works
Each month, we use the MND Sheinbaum Index™ methodology to calculate a single score out of 100. The Index has eight equally weighted pillars — each contributing a score of up to 12.5 points to the final composite out of 100. Each pillar score is calculated using raw data, which is mainly sourced from the national statistics agency INEGI.
Here is a short guide to the significance of a Sheinbaum Index score:
- 85–100: Exceptional — administration performing at a high level across nearly all indicators.
- 75–84: Excellent — administration performing well across most indicators.
- 60–75: Room for improvement — meaningful strengths, some areas of concern.
- 50–60: Mixed — passing marks overall.
- Below 50: Broad underperformance — more indicators below benchmark than above.
The 8 pillars and how they are scored
1. Inflation:
In this pillar, we measure how close Mexico’s headline inflation rate is to the Bank of Mexico’s 3% target. On-target scores 100; each percentage point above costs 20 points. For this pillar and all others, the raw score out of 100 is converted to a number out of 12.5, reflecting the actual contribution it makes to the overall MND Sheinbaum Index™ score.
2. Approval rating:
The score for this pillar is derived from the presidential approval ratings yielded by two leading polls, those conducted on a monthly basis by El Financiero and Mitofsky/El Economista. The average of the two approval ratings produces a percentage score, which is then converted into a score out of 12.5.
3. Economic growth:
4. Security:
This pillar tracks the year-on-year change in the national homicide rate, per the National Public Security System data reported at President Sheinbaum’s morning press conference. A 0% annual change scores 30 — because stagnation on violence is not good enough. A 50% reduction scores 100.
5. Employment:
This pillar is equally weighted between year-on-year changes in unemployment and informality. For both components, a score of 50 is neutral — meaning the indicator is exactly where it was a year ago, neither better nor worse. For unemployment, every 0.1 percentage point improvement or deterioration adds or deducts 5 points. For informality, each full percentage point of improvement adds 20 points, while each point of deterioration deducts 20.
6. Business confidence:
This pillar is equally weighted between INEGI’s monthly business confidence score and the most recently published foreign direct investment growth rate. FDI indicates whether the international business community believes in Mexico’s trajectory; business confidence data reflects domestic private sector sentiment.
The business confidence sub-component anchors at 50 — a neutral INEGI reading scores 50, with each one-point index shift adding or deducting 5 points. FDI anchors lower: zero growth scores only 40, with each 10 percentage points of growth adding 20 points, capped at 100 for growth of 30% or above.
7. Tourism:
This pillar looks at year-on-year growth in international visitor arrivals. Zero growth scores 50, while 20% growth in arrivals hits the 100 ceiling and a 20% reduction reaches the 0 floor. This pillar updates on a one-month lag as INEGI’s tourism data is published approximately six weeks after the conclusion of the reference month.
8. Labor poverty:
This pillar is equally weighted between the share of Mexicans living in households where combined labor income is insufficient to cover a basic monthly food basket per person (the labor poverty rate), and real per capita income growth. INEGI publishes data on these two components on a quarterly basis.
For labor poverty, a score of 50 is given if there is no year-over-year change in the rate. Each percentage point improvement adds 10 points, meaning that a reduction of five percentage points or more gets a score of 100. A score of 0 is given for an annual increase of five percentage points or more in the labor poverty rate.
For real income, each percentage point of annual growth adds four points to the neutral score of 50, benchmarked at 0% year-over-year growth. Therefore, 12.5% growth achieves a score of 100. Any decline in income is penalized, with a 12.5% reduction scoring 0.
* MND acknowledges that President Sheinbaum does not directly control outcomes in all eight pillars. For example, global commodity prices and tariff decisions in Washington can affect Mexico’s inflation and growth rates. The Index measures what is happening in Mexico on Sheinbaum’s watch.
A note on education and healthcare
Two pillars conspicuously absent from the Index are education and healthcare — not because they don’t matter, but because official data on them is not published monthly, or even quarterly.
The MND Sheinbaum Index™ over the past 5 months
We have now calculated MND Sheinbaum Index™ scores for the first four months of 2026 and the final month of 2025. Over that period, the index score has remained in the 60s, peaking at 65.6 in December and bottoming out at 60.0 in April.
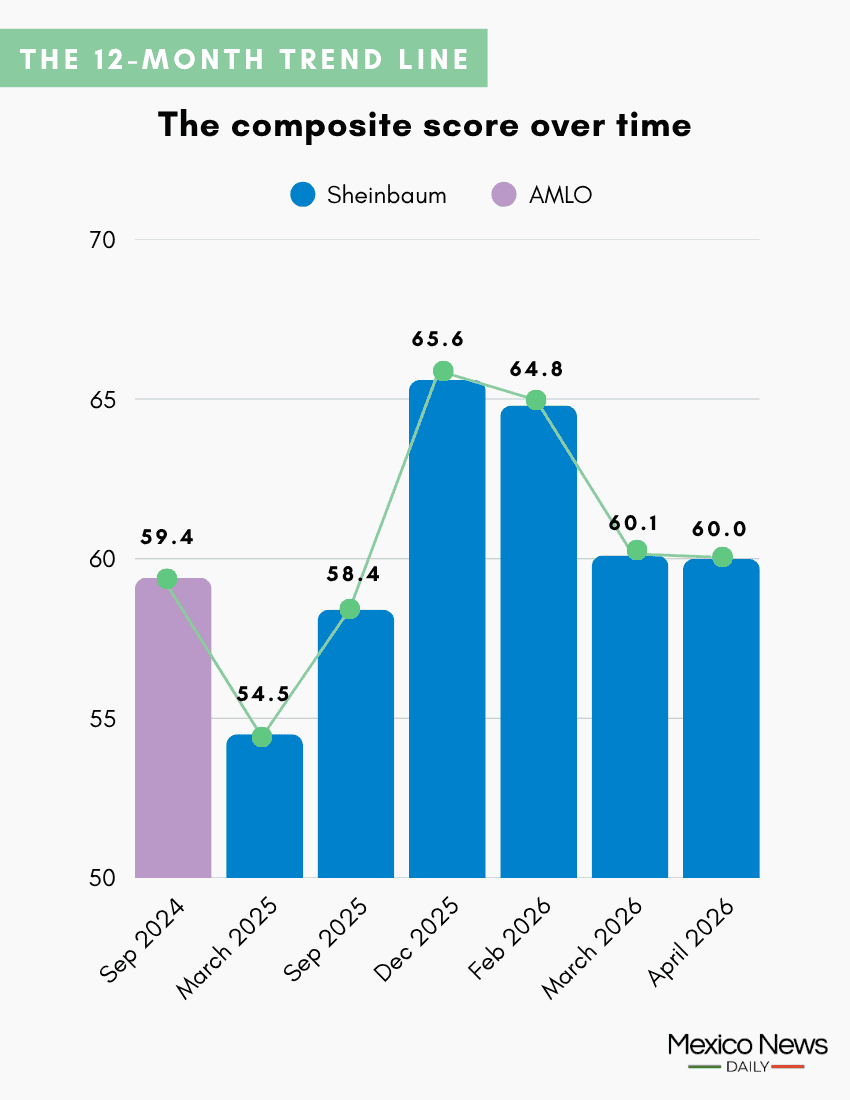
The peak in December was supported by year-over-year economic growth of 2.4%, an annual inflation rate only 0.69 points above the Bank of Mexico’s 3% target and a year-over-year decline in homicides of almost 30%, among other factors.
The two-point month-over-month decline to an index score of 63.7 in January was due to factors such as a reduction in the annual economic growth rate to +0.5%, a slight increase in inflation and waning business confidence due to deteriorations in both components of that pillar. However, some pillars of the index did improve in January compared to December, including security, due to a 34% year-over-year decline in homicides.
The index score improved slightly in February to reach 64.8. Stronger economic growth (+1.2%), a slightly higher aggregate approval rating for Sheinbaum (70.6%) and a lower year-over-year increase in the informality rate (+0.3 percentage points) contributed to the higher index score.
The nearly 5-point deterioration of the index score to 60.1 in March was due to an increase in the headline inflation rate (4.59%), slower economic growth (0.5%) and a smaller — albeit still significant — decline in homicides (-31.4%), among other factors.
The decline in the index score to 60 in April marks the second deterioration in as many months. We explain what happened in each of the pillars in April below.
MND Sheinbaum Index™ pillars for April 2026
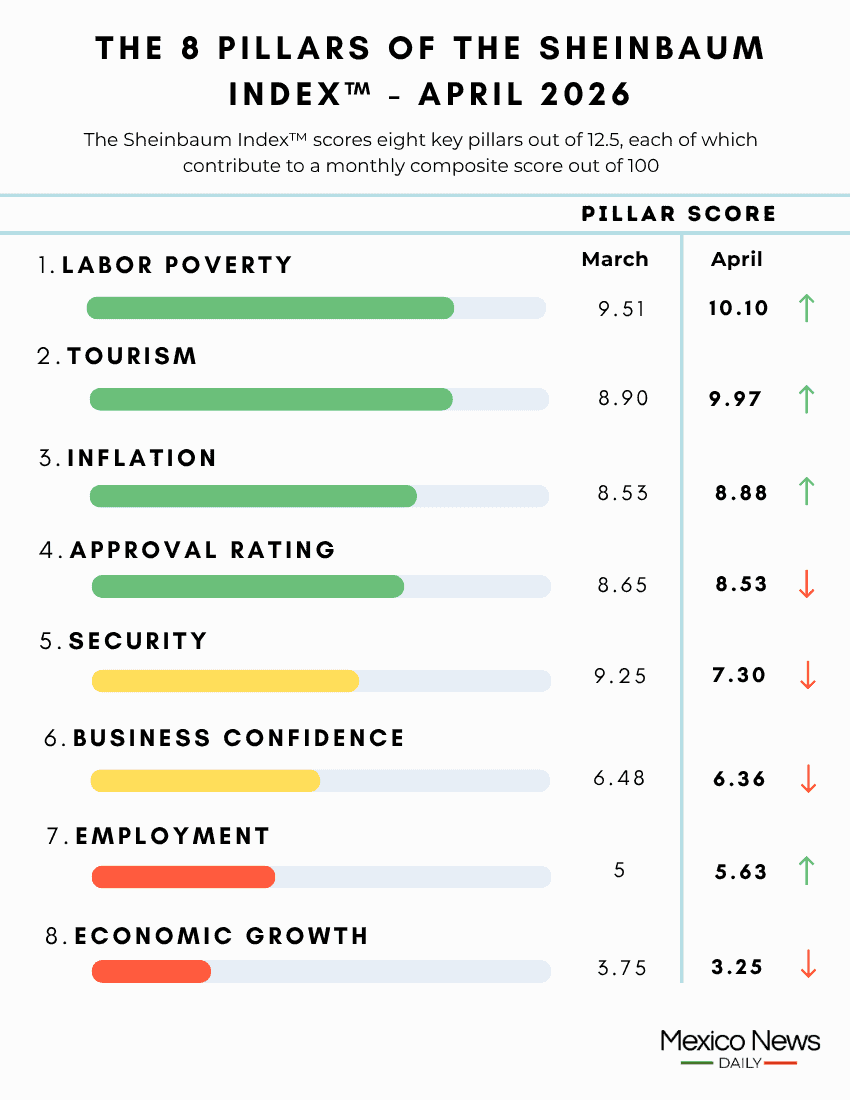
Each pillar is given a stoplight color indicating a strong performance (green), an average performance (yellow) or a poor performance (red). An upward pointing arrow ⬆️ indicates that the pillar score improved compared to March. A downward pointing arrow ⬇️ indicates a deterioration in the pillar score.
🟢 ⬆️ LABOR POVERTY (10.10 out of 12.50)
The labor poverty pillar was once again the top contributor to the overall index score. The score increased from 9.51 in March to 10.10 in April thanks to improvements in both pillar components. The labor poverty rate decreased 3.2 percentage points annually to 30.7% in the first quarter of 2026. Real incomes increased 7.4% year-over-year.
🟢 ⬆️ TOURISM (9.97 out of 12.50 — This pillar has a one-month lag):
International arrivals increased 11.9% in March, up from an 8.5% rise in February. The double-digit increase was particularly notable as it came after widespread violence in Mexico in late February triggered by a Mexican military operation that resulted in the death of Jalisco New Generation Cartel leader Nemesio “El Mencho” Oseguera Cervantes. The tourism pillar score increased from 8.90 in March (based on February data) to 9.97 in April (based on March data).
🟢 ⬆️ INFLATION (8.88 out of 12.50):
Mexico’s annual headline inflation rate eased from 4.59% in March to 4.45% in April. The inflation pillar score consequently increased to 8.88 from 8.53 a month earlier.
🟢 ⬇️ APPROVAL RATING (8.53 out of 12.50)
Sheinbaum’s approval rating fell to 68.2% in April from 69.2% a month earlier. At the time of publication, El Economista/Mitofsky had not published poll results for April so we carried over the 68.4% result from March. Per El Financiero, the president’s approval rating fell to 68% in April from 70% in March. The approval rating pillar score fell 0.12 points from 8.65 in March to 8.53 in April.
🟡 ⬇️ SECURITY (7.30 out of 12.50):
The pace of the reduction in homicides slowed for a third consecutive month in April. The year-over-year decline last month was 20.3%, below the 31.4% and 35% reductions reported by the government for March and February, respectively. The security pillar score consequently fell from 9.25 in March to 7.30 in April. A change in the stoplight color from green to yellow reflects that deterioration.
🟡 ⬇️ BUSINESS CONFIDENCE (6.36 out of 12.50)
Mexico’s business confidence score, as measured by a monthly INEGI survey, fell to 48.2 in April from 48.4 in March. In this second edition of the index, we replace the foreign direct investment result for 2025 (+10.8%) with the result for the first quarter of 2026, which the federal Economy Ministry announced this week. FDI increased 10.4% in Q1 compared to the same period of last year. Due to the slight decreases in both business confidence pillar components, the pillar score fell to 6.36 from 6.48 in March.
🔴 ⬆️ EMPLOYMENT (5.63 out of 12.50)
Mexico’s unemployment rate was 2.5% in April, unchanged from the same month of 2025. The unemployment score improved compared to March, as the jobless rate increased 0.2 points in that month. Mexico’s informality rate — the percentage of all workers who work in the vast informal sector — increased 0.5 points annually to 55.2% in April. The year-over-year growth in the informality rate was unchanged from March. Due to the improvement in the unemployment score, the pillar score increased 0.63 points to 5.63 in April from 5.0 in March.
🔴 ⬇️ ECONOMIC GROWTH (3.25 out of 12.50)
Year-over-year economic growth in April was 0.3%, according to preliminary data from INEGI. That figure represents a 0.2 percentage point slowdown from the growth rate recorded in March. The economic growth pillar score consequently fell from 3.75 in March to an even weaker 3.25 in April.
What to watch
The next MND Sheinbaum Index™ will focus on the month of May.
Here are three things to look out for in the May Index:
- Inflation: Data for the first half of May indicates that the score for the inflation pillar will continue to improve. INEGI reported last week that the annual headline rate was 4.11% in the first 15 days of May, a significant improvement from the 4.45% reading for April as a whole.
- Security: It appears likely that the security pillar score will also improve in May. Data presented by the federal government this week showed that homicides were down 31.4% annually so far in May. A similar decline for the month as a whole would represent a significant improvement from the 20.3% decrease in homicides recorded in April.
- Tourism: While the labor poverty pillar was once again the top contributor to the overall index score in April, the tourism pillar was not far behind. If international arrivals increase 12.3% or more in April (remember this pillar has a one-month lag), tourism could replace labor poverty as the top contributor to the May index. The score for the labor poverty pillar won’t change in the May index as the most recent data will still be that for the first quarter of 2026, which INEGI published this week.
Mexico News Daily
The post The MND Sheinbaum Index™: Sheinbaum scores 60.0 for April 2026 appeared first on Mexico News Daily


Comments
Post a Comment